Programs that contain run-time errors compile, but they "crash" or fail to end when they run. If a program crashes, the system may display a diagnostic that helps programmers locate the error, but a program that fails to terminate produces no diagnostics. In either case, locating the error is the first step programmers must take to identify and correct it. Run-time errors are typically a subclass of logical errors, which suggests that programmers locate them by instrumenting the code or using a debugger.
Fortunately, none of the programming operations introduced in the first chapters are likely to cause a run-time error. However, this situation makes it difficult to demonstrate a run-time error by causing one. So, the following examples rely on trivial pseudocode to illustrate the debugging techniques.
Bracketing A Run-time Error
run-time error, tracing, bracketing
Run-time errors are difficult to locate because they may run many statements before unexpectedly failing catastrophically. If run-time errors are a sub-class of logical errors, then it seems reasonable to locate them using a similar strategy. Step 2 of the logical-error-location strategy is, "Trace the calculations through program execution." While intermediate values may help programmers correct a run-time error, the primary goal is locating the statement causing it. To locate a run-time error, programmers bracket it with tracing operations implemented with instrumentation statements or a debugger. If the program displays the first tracing statement but not the second, programmers know the run-time error lies between the two tracing operations. Programmers move the operations closer together and rerun the program. Initially, the tracing operations may surround many programming statements, but programmers eliminate suspect statements as they move the bracketing operations together, narrowing the search.
Begin by placing two tracing operations in the program experiencing a run-time error. Place the first operation before the suspected error location and the second after.
If neither operation displays information
The run-time error lies below the second tracing operation
Move the bottom tracing operation downward
If both operations display information
None of the statements between the two operations cause the run-time error
Move both tracing operations downward to surround another block of suspect code
If the first operation displays information but the second does not
If there is only one statement between the tracing operations, or the error is obvious
Begin debugging, treating the problem as a logical or run-time error as appropriate
The run-time error lies between the two tracing operations
Move the two output statements closer together: move the top operation down, the bottom operation up, or both
Repeat the run-time error location strategy
Strategy for locating a run-time error.
The goal is to reduce the amount of code that can potentially cause a run-time error. Focusing our attention on a small, restricted region is often enough to help us recognize and correct the error. If we can't identify the error, the narrowed region gives us a smaller area to search when debugging.
While the strategy describes bracketing a run-time error with two tracing operations, programmers are not limited to only two. Sometimes, especially at the beginning of the process, it's desirable to use multiple operations spread throughout the suspect code. Regardless of the number of operations, programmers apply the strategy to adjacent pairs.
Locating A Run-time Error: Manually Instrumenting The Code
run-time error, instrument code, Bad Tuna, preprocessor, __FILE__, __LINE__
While the values of variables and other expressions may ultimately help debug a run-time error, locating it is the initial step. To trace program execution, programmers insert statements that signal, "The program made it this far before failing." So, the only requirement of the instrumented code's output is that it uniquely identifies a reached location in the program. I suspect that this was the purpose of the "Bad Tuna" message described previously.
Locating run-time errors with instrumented code.
Authentic programs typically consist of many statements, often spread over many files. So, when a program exhibits a run-time error, programmers often instrument it to locate the error. However, run-time errors either cause a program to "crash" (abort abruptly) or never terminate. Either way, the program ceases its normal operation before the instrumentation can announce the error, its cause, or its location. Consequently, programs must execute the instrumentation before the run-time error occurs. The example highlights the instrumentation statements in green and the statement causing the run-time error in red.
Programmers begin by surrounding or bracketing suspect statements with instrumenting code.
They iteratively move the bracketing instrumentation closer together until they identify the statement causing the run-time error.
Syntax-error-diagnostics include the file name and (approximate) line number of the error, and assembly-error-diagnostics include the file name. For large, complex programs, especially those with functions, you may need to use many sets of bracketing operations. The file name and line number of a specific instrumenting statement are beneficial in at least two ways:
Together, the file name and line number uniquely identify each instrumenting statement without requiring an additional label. They also help programmers locate run-time errors when a program contains many sets of bracketing statements.
The file name and line number help programmers find and remove the instrumenting statements when they are no longer needed.
The preprocessor replaces two predefined variables with the file name and line number, respectively:
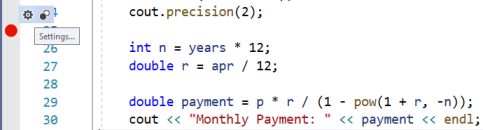
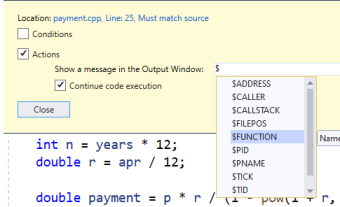
The logic and bracketing process for locating run-time errors is independent of how programmers do it, implying that they can use either manual instrumentation or a debugger. Nevertheless, a debugger automates and simplifies the task, and has the advantage that removing the tracing operations is fast and easy. Programmers implement tracepoints in Visual Studio as illustrated in Figure 10 of the previous section, or they can leverage tracepoints' status as specialized breakpoints as illustrated in the following figure:
Programmers create a breakpoint by left-clicking in the grey column next to a statement, then convert it to a tracepoint by right-clicking the circle or by hovering the mouse pointer over the circle and pressing the "gear" button in the pop-up menu.
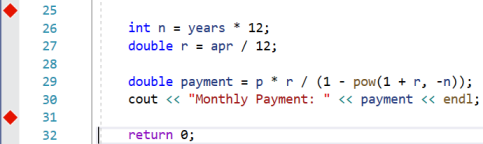
Checking the "Actions" checkbox converts a breakpoint to a tracepoint. Programmers can enter labels such as "Start" or "Done" or evaluate expressions as illustrated in the previous section. Typing a "$" in the input field displays another menu. Two predefined action variables, $FUNCTION and $FILEPOS, display the file's full name and the statement's line number in the tracepoint output. Tracepoints must be attached to an executable statement, so the example displays line numbers 26 and 32.
Following the Figure 1 strategy, programmers bracket blocks of code suspected of containing a run-time error with tracepoints, and move the tracepoints together to locate the error. Like breakpoints, programmers remove all tracepoints with the menu "Debug → Delete All Breakpoints" or the keyboard shortcut Ctrl-Shift-F9.