The compiler component produces error messages that alert us to the presence of syntax errors, and that help us locate them. The linker also produces error messages that alert us to the presence of link errors and typically (but not always) provide some indication of the problem. On the other hand, logical errors do not produce any error messages - the program compiles and runs. However, programs with logical errors produce incorrect output, no output, or never terminate. The underlying error may be a large, significant misunderstanding about how to solve the problem, a misplaced parenthesis, or any of a myriad of problems in between.
Every program must be tested and validated before it is considered correct. Developers use sets of test cases to validate programs. A test case is nothing more than a set of input values and the expected program output; in the "real world," developers design test cases simultaneously with the software itself. If a program produces the correct output for every test case, then there is a good chance that the program is correct - but it is still possible that the program contains an error, and one more test case may have identified it. Once a failed test case indicates a program has a logical error, the developer's next task is locating and identifying it.
Manually calculate the intermediate results needed to produce the final output. Record the final result and the results of intermediate calculations.
Instrument (i.e., temporarily add output statements) to your code to display the intermediate values. Programs can store the intermediate results in temporary variables or recalculate them in the output statements. Using temporary variables as a debugger tool generally violates the Misusing temporary variables warning presented earlier, so you should remove the debugging code from the final program.
Compare the calculated results with those produced by the program to locate the error in the code.
Steps for locating a logical error. When a program compiles and runs but fails a test case, programmers can use this three-step process to locate the error(s).
Manually Locating A Logical Error
An example makes the three-step process much easier to understand. The first (primitive) approach is conceptually easy to follow, can be used with any development environment, and will help us understand how the debugger operates. The first version of the ftoc.cpp program written earlier had a logical error, and we can use that version to demonstrate how to localize such an error.
\[c = {5 \over 9} (f - 32) \]
Input
Expression
Expected
Output
32
f
32
5/9
0.555556
f-32
0
5/9*(f-32)
0
0
Input
Expression
Expected
Output
212
f
212
5/9
0.555556
f-32
180
5/9*(f-32)
100
100
Formula
Test Case 1
Test Case 2
Step 1: Calculate intermediate values. Begin by calculating the intermediate results by hand, which, in the case of the Fahrenheit-to-Celsius conversion program, are the sub-expressions appearing in the formula. From the formula, we identify four sub-expressions of interest:
f, the program input
5/9
f-32
5/9*(f-32), the program output
It may seem like a waste of time to check the input value because it doesn't represent a significant computation. However, it is possible to make a simple error on the data input - for example, two input operations targeting the same variable (in a more complex program) or simply entering some data incorrectly. If we ignore that possibility and focus on the following code, we may never find an input error. Once the input is validated, then we KNOW that we have not made such an error and can safely focus our attention on the more complex computations that follow.
#include <iostream>
using namespace std;

int main()
{
	double	f;
	cout << "Enter a temperature in Fahrenheit: ";
	cin >> f;
	cout << f << endl;

	cout << 5 / 9 << endl;
	cout << f - 32 << endl;
	double	c = 5 / 9 * (f - 32);

	cout << "The temperature in Celsius = " << c << endl;

	return 0;
}
Step 2: Instrument the code. Next, we temporarily instrument the code by printing the results of the intermediate calculations (highlighted in yellow). The program user doesn't need to see this output and may find it quite confusing, so it's important to remove the instrumentation once debugging is complete.
When we first ran the test cases, before instrumenting the code, the first test case "passed" in the sense that it produced the correct output. Nevertheless, there was a bug in the first version of the program, which underscores the importance of using multiple test cases to test and validate even simple code. Comparing the output from the instrumented code with the expected intermediate values will detect the error using either test case.
Expression
Expected
Observed
f
212
212
5/9
0.555556
0
f-32
180
180
5/9*(f-32)
100
0
Step 3: Trace the calculations. Finally, we compare the program output with the test cases. Programmers can use either test case to locate the error, but it was the second case that alerted us to the bug, so it is natural to begin with it. Comparing the output from the instrumented code with the expected output calculated in Step 1, it's clear that the calculation of 5/9 is incorrect. This technique locates the bug but does not specify the cause or the solution - programmers are responsible for understanding the code's behavior. The program evaluates 5/9 using integer arithmetic, resulting in 0 and creating the fundamental program bug.
Debugging With A Debugger
Manually instrumenting code always works the same on every computer and with every compiler, so it doesn't require us to learn how to use a specific debugger. But its most significant advantage is that it's easy to understand. Nevertheless, manually instrumenting code is tedious in many ways. First, we must edit and recompile the program whenever we want to examine a different part of it. Second, it's difficult to control the output, particularly in loops. Finally, we must remove the instrumenting code after finishing the debugging session because the extraneous output could confuse a user or cause problems if other programs process the output.
Most modern integrated development environments (IDEs) include a debugger that allows developers to step through the code and examine the values stored in variables or calculated by expressions. In this way, a debugger automates step 2 of the three-step process outlined above for localizing a bug in a program. The following demonstrations illustrate how to manually instrument code and use a debugger to follow program execution and view the results of intermediate program calculations. Although the debugger examples demonstrate the Visual Studio debugger, you will find that other debuggers are similar.
Examining Expressions
#include <iostream>
using namespace std;

int main()
{
	double	f;
	cout << "Enter a temperature in Fahrenheit: ";
	cin >> f;

	double	c = 5 / 9 * (f - 32);

	cout << "The temperature in Celsius = " << c << endl;

	return 0;
}
Debugging the temperature program. The debugger demonstration begins with the original, uninstumented code. All our debugging operations will occur in the yellow highlighted statement in the program above. Visual Studio typically has two or more controls for each operation - some longer and some shorter. There are shortcuts for some of the following steps, but the demonstration takes a longer approach because some of the presented steps are required for later demonstrations. Build the project as usual, and then follow the steps below.
Place the cursor on the highlighted statement
Right-click
Select "Breakpoint" from the popup menu.
Select "Insert Breakpoint" from the fly-out menu.
A large red dot should appear on the left edge of the editor window on the line corresponding to the highlighted statement. The red dot denotes a breakpoint. When a program runs in debug mode with breakpoints set, the program automatically pauses or suspends execution at each breakpoint.
Select "Debug" from the main menu at the top of Visual Studio.
The next step differs from previous examples: Select "Start Debugging."
The console window opens and displays the prompt. Type 212 and press enter.
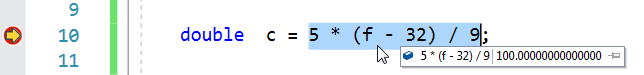
Examining expression values with the debugger. The arrow inside the red dot indicates that program execution has paused at the breakpoint and is ready for debugging.
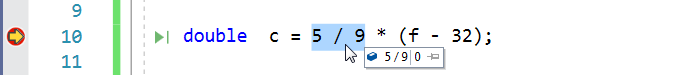
Highlight (left-click and drag) the expression whose value you want to see.
Place the mouse pointer inside the highlighted region.
The expression and its current value appear next to the cursor.
The debugger displays the current values of two sub-expressions that are a part of the temperature conversion formula. From the displayed values, it's easy to see which expression is incorrect and is therefore programmed incorrectly. To end the debugging session:
Open "Debug" from the main menu, choose one of "Continue" or "Stop Debugging," and close the console window.
Right-click at the beginning of the Celsius calculation, select "Breakpoint," and then "Delete Breakpoint."
(a)
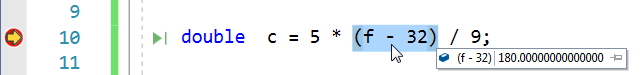
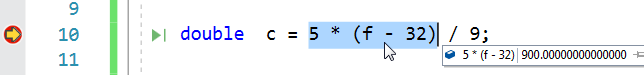
double c = 5 * (f - 32) / 9;
(b)
(c)
(d)
Examining evaluation order with the debugger. One way of correcting the error in the temperature conversion program, illustrated in the original example, is to change the order of operations by rewriting the code. The debugger allows us to examine each sub-expression as the program evaluates it. Modify the code and build the project. As before, set a breakpoint and run the program.
The rearranged and corrected code.
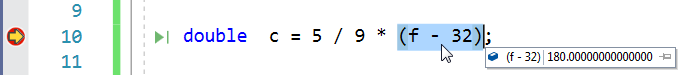
The parentheses cause the subtraction operation to take place first. The sub-expression is double-valued because the variable f is type double, causing the program to promote 32 to 32.0 before performing the subtraction. The debugger demonstrates that the operation is correct.
The multiplication operation takes place next. Again, the sub-expression is double-valued, causing the program to promote 5 to 5.0 before the multiplication occurs. The debugger again demonstrates that the sub-expression is correct.
The division operation runs last, producing another double-valued result as verified by the debugger.
Some Debugger Shortcuts
(a)
(b)
(c)
Debugger context controls. Programmers can access all debugger controls through the "Debug" menu, as in the previous example. But many of the most common operations are also available through a set of context controls appearing in the second row. Context controls can change depending on what Visual Studio is doing at any given time.
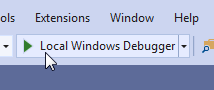
The "Run" button (green arrow) appears before the program begins execution.
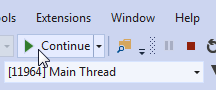
While the program is paused at a breakpoint, the green arrow becomes the "Continue" button.
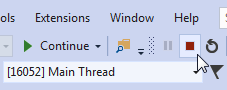
The "Stop" button (red square) also appears while the program is paused at a breakpoint
Following Program Execution With Breakpoints
In the special case of the error in the ftoc program, the debugger quickly exposes the error without any additional preparation. In more general cases, programmers must still manually carry out steps 1 (calculate intermediate results) and 3 (compare the calculated and program results). But a debugger allows us to skip step 3 (instrumenting the code) and makes step 3 much easier.
To debug a program, we often need to follow or trace the execution of individual statements as they run. Tracing a program gives us an idea of "where the program is going and what it is doing." Consider a simple if-else statement: the program can take one of two distinct execution paths. Which path does the program follow? What values has the program saved in the statement's variables? We often think we know the answers to those questions but are too often wrong. Sometimes, calculations before the if-statement are wrong, or there is an unnoticed error in the if-test. Either of these errors can send the program down the wrong path. Following the program's execution helps us to detect and locate these kinds of errors.
Both the necessity and the difficulty of following a program's execution increase as the program's size and complexity increase. We begin by exploring how to manually follow a program by viewing the values saved in variables and calculated by expressions and sub-expressions. Then, we automate the process with a debugger. The examples presented in the following figures revisit the payment.cpp example.
int	n = years * 12;
cout << "n = " << n << endl;
double	r = apr / 12;
cout << "r = " << r << endl;
cout << "p * r = " << p * r << endl;
cout << "pow = " << pow(1 + r, -n) << endl;
double	payment = p * r / (1 - pow(1 + r, -n));
cout << "payment = " << payment << endl;
(a)
(b)
Manually instrumenting code. Programmers instrument code by adding temporary output statements, highlighted in yellow. The output does not satisfy any program requirements or provide any end-user information. However, their output establishes the program's statement execution sequence and the values each sub-expression produces.
Instrumenting code that displays which execution path a program takes. Programmers can use this information to debug the if-test (represented by ellipses). Similar code can help debug loops.
Programmers can check the value of variables or expressions by comparing the values they calculate with the output of the instrumenting code.
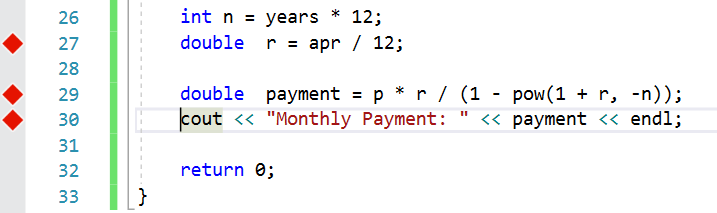
Debugging with a breakpoint. Programmers can use breakpoints to follow a program's execution, both the path and the values saved in variables and calculated by expressions. Furthermore, breakpoints automate the tracing process - programmers don't need to add and later remove any instrumenting code! The key to understanding this example is knowing what a program does when encountering a breakpoint: the debugger pauses execution before running the statement following the breakpoint. So, if we set a breakpoint on line 29, the debugger would pause before a value is stored in the variable "payment."
Either copy the payment program or reopen the previous project.
If appropriate, save and compile the program. Remember to set it as the "Startup Project."
Set a single breakpoint on the "return 0;" statement.
Run the program: principle = 100000, apr = 0.08, and years = 30.
The program pauses after all calculations are complete but before returning (i.e., before program termination).
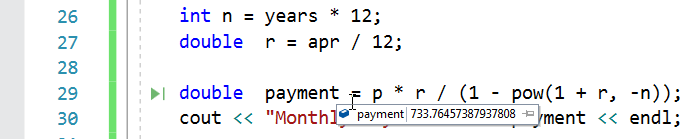
Hover the pointer over any variable you wish to examine, as is illustrated for the "payment" variable.
Remove the breakpoint: (a) right-click the large red dot, or (b) right-click in front of the return statement and remove the breakpoint through the menus as was done in Figure 6.
Examining Statements With Tracepoints
Using tracepoints is quite easy. The next example appears lengthy only because of the many illustrations. But the screen captures make it easier to see the critical steps.
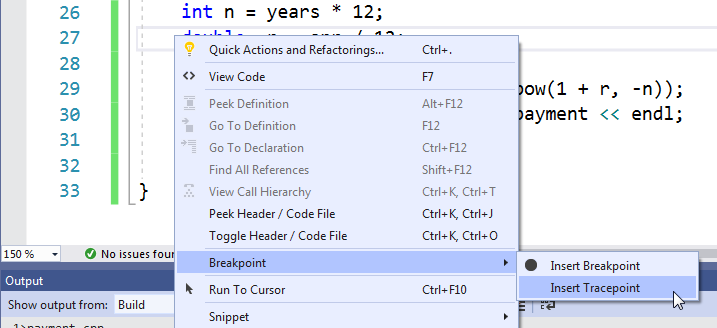
Setting a tracepoint. Set a tracepoint on line 27. (Note that this is after the calculation of n but before the calculation of r.) Right-click on line 27 and select "Breakpoint" followed by "Insert Tracepoint."
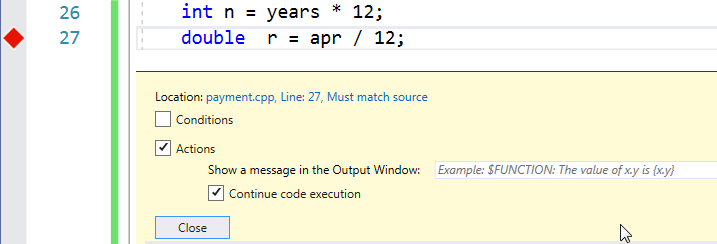
Set a tracepoint action. Check the box marked "Actions," which opens a text field. Enter an action in the text field. The example suggests that the output can be very detailed, but we'll keep the action simple.
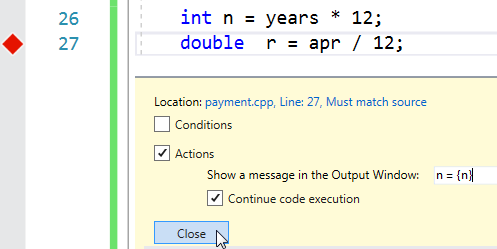
Specifying an action. In the text field, enter the output message: n = {n}. The debugger displays verbatim any text outside the braces; it evaluates the text inside the braces and displays the resulting value. The debugger writes these messages to the Output window, allowing programmers to watch any variable or expression. This technique separates debugging output from the program's normal output that still goes to the console. Press the "Close" button when finished.
Add tracepoints for all variables you wish to examine. Following the pattern demonstrated in the previous figure, add tracepoints on lines 29 and 30:
Line 29: r = {r}
Line 30: payment = {payment}
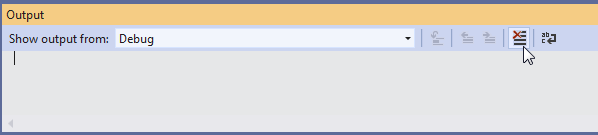
Clearing the output window. Programmers may run the program many times, perhaps with different inputs each time. They can allow the debugging messages to accumulate between each run, or they may clear the Output between runs by pressing the "Clear" button between runs.
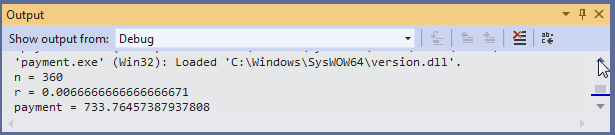
Creating and viewing trace messages. Run the program in debug mode, as in the previous examples. Use the slider bar or buttons on the right of the Output window to scroll the contents until the trace messages become visible. The trace messages show the values of n, r, and payment.