Just as manually instrumenting code helped us understand and debug statements, it can also help us understand and debug loops. Manually instrumenting loops has the dual disadvantages of requiring us to insert output statements when exploring a program's behavior and removing them when we are finished. Instrumentation still works with loops that primarily perform some calculation, like the while-loop in the gcd example. However, when the loop produces output during each iteration, the loop and instrumentation outputs are intermixed, making it difficult to read and understand either output. Worse still is the case where the output's formatting is a significant part of the solution (as with multtab). These situations are where the debugger demonstrates its value.
We'll use multtab, a program written previously in this chapter, to demonstrate some new debugger features. There are several reasons for choosing multtab.
It's small so that we can focus on the example, not the program.
Second, it has nested loops whose behavior we can more easily understand with a debugger, demonstrating its usefulness.
And finally, it generates console output during each iteration, making manual instrumentation more difficult to use.
The following screen captures show which controls to use but cannot show the debugger's full dynamic behavior. Watch the accompanying video to see better how the debugger operates.
#include <iostream>
#include <iomanip>
using namespace std;

int main()
{
	for (int i = 1; i <= 12; i++)
	{
		for (int j = 1; j <= 12; j++)
			cout << setw(5) << i * j;
		cout << endl;
	}

	return 0;
}
Demonstrating the debugger with multtab.cpp. You'll learn more about using the debugger and remember it better by following the example. Begin by ensuring that multtab is loaded, compiled, and set as the startup project.
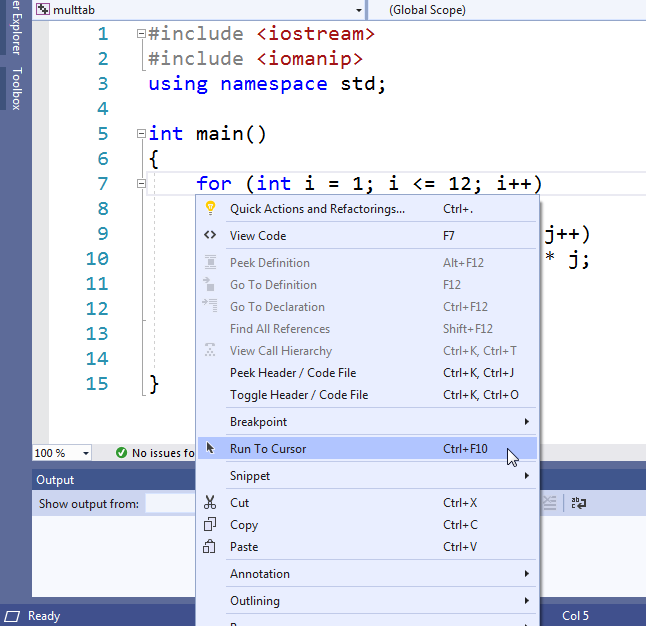
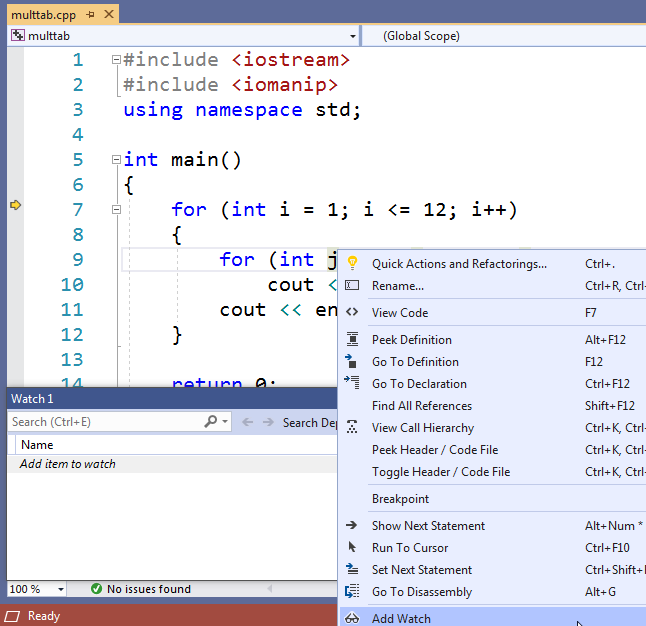
The "Run To Cursor" operation. Position the mouse pointer on the line where debugging begins. In this example, place the cursor on line 7, the outer loop that drives the program through the rows. Right-click and select "Run To Cursor." The program begins running but pauses at the beginning of line 7.
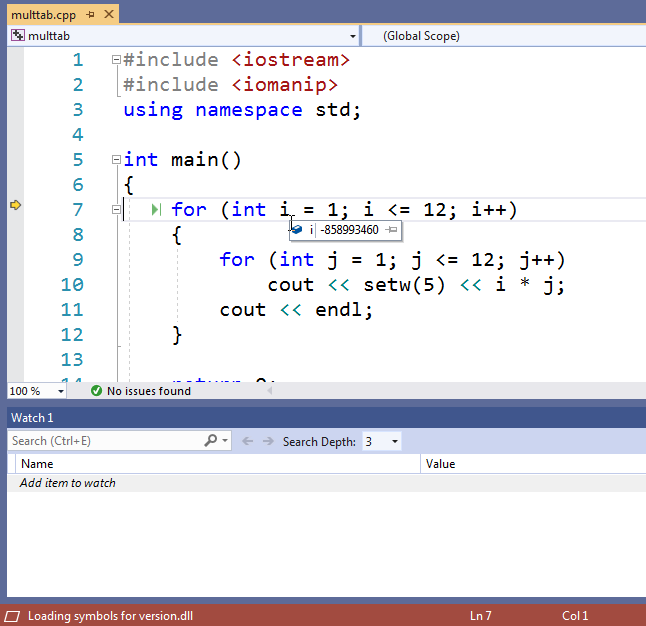
Examining variable contents. Just as when we used a breakpoint to pause the program, we can still mouse over a variable to see the current value. Hovering the mouse pointer over variable i, the loop control variable of the outer loop, it seems to have a very negative value. That's because i hasn't been initialized yet, so it contains a random value. But hovering the mouse pointer over variable j doesn't display any output because j is out of scope and so isn't defined yet.
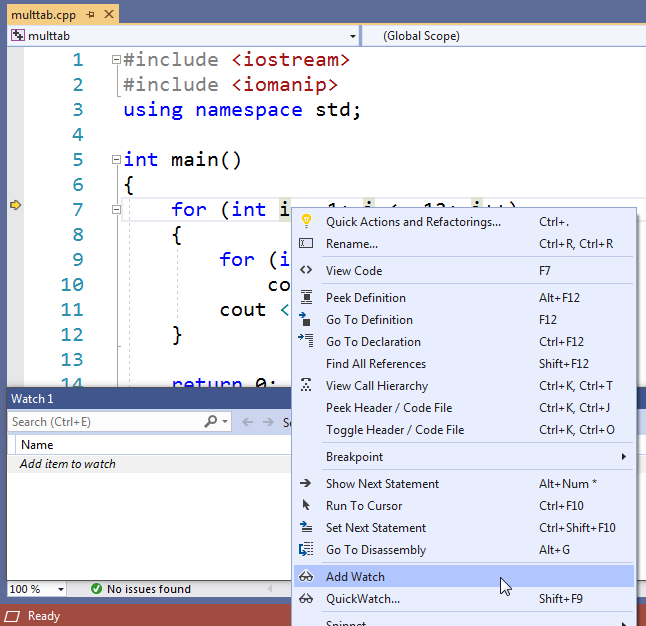
Watching variables. Right-click on or just behind the variable, and select "Add Watch."
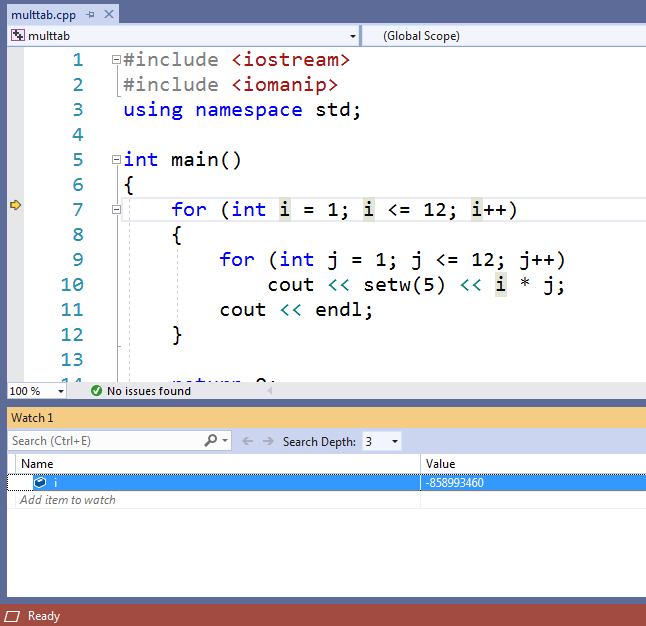
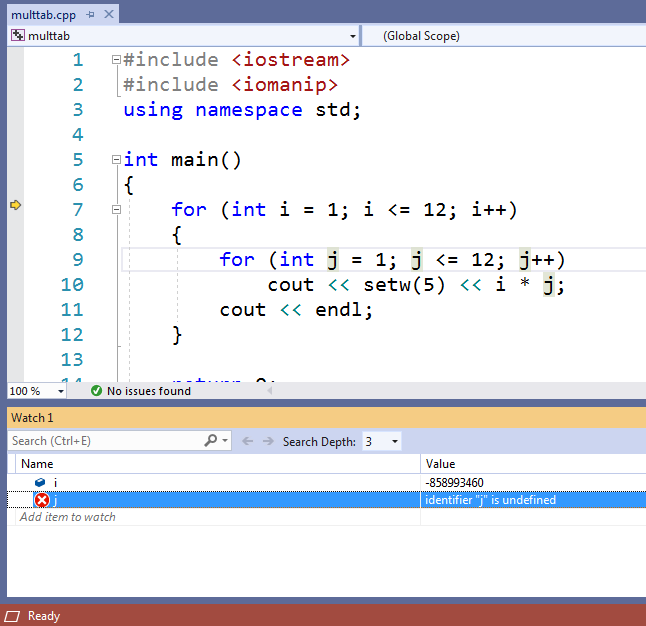
The "Watch" window. A "Watch" window opens at the bottom and an entry for variable i is visible. The entry is currently very negative, indicating that the variable is uninitialized. The debugger displays the current value stored in i whenever the program updates the value.
Watch a second variable. Add a watch for variable j following the steps above.
Updating the watch window. Adding the variable j to the watch list makes it clear that j is undefined. You can add watches for any variable or expression whose value you want to track – not just the loop control variables. You can also add a variable or expression directly into the watch window by entering its name or the expression in the field labeled "Add item to watch."
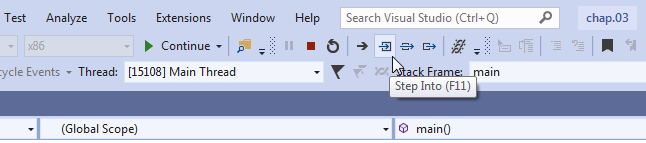
The single-step button. The main control used for this debugging session is the context single-step button. This button implements one of the most useful debugger operations - the ability to execute and observe the program one statement at a time.
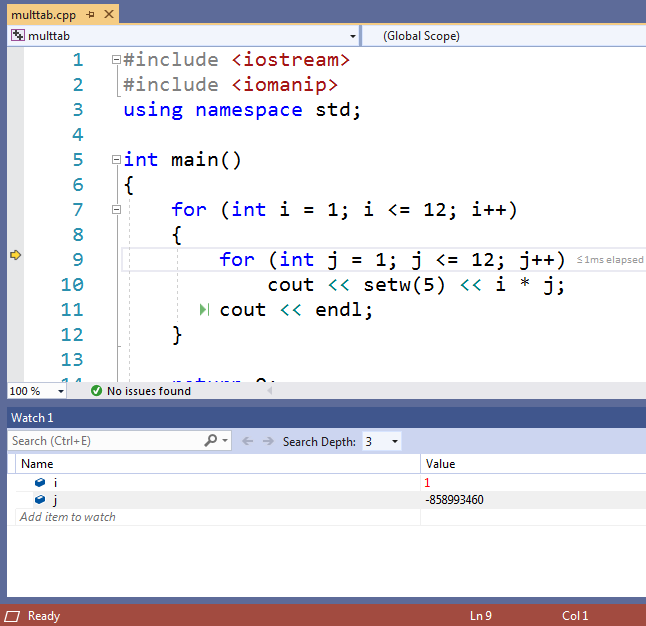
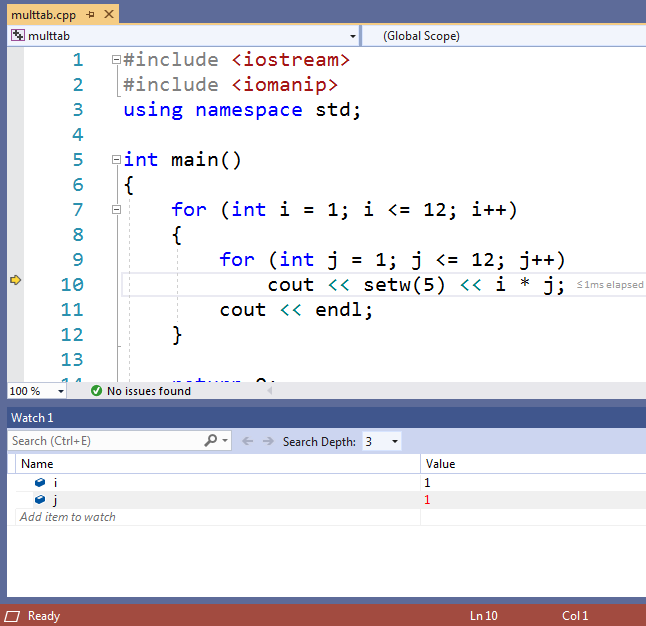
Single-Stepping. Press the single-step button once and observe the changes in the Watch window: The program initializes the value in variable i to 1, and j, although uninitialized, is now defined.
Single-Stepping through nested loops. Pressing the single-step button again initializes both loop control variables. The arrow at the far left of line 10 indicates the running statement.
Stepping through the inner loop. Press the single-step button several times and watch the arrow on the left. The inner loop continues to run, producing a line of output on the console. Continue pressing the single-step button until j reaches a value of 12.
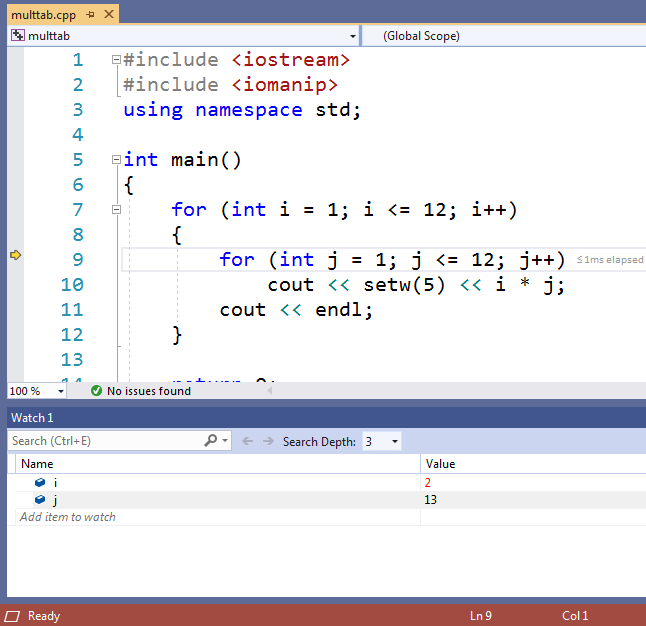
Ending the inner loop. Beginning with the arrow on line 9. slowly press the single-step button until the arrow moves to line 12. Notice that j advances to 13, ending the inner loop, and increases i to 2.
The second iteration of the outer loop. Continue pressing the single-step button, moving the arrow to line 7, and updating the value saved in i to 2. The outer begins its next iteration, marked by a new line in the console window. If you continue pressing the step button, you can watch each entry print in the multiplication window. You can see the lines grow one product at a time, and you can see each line begin when the inner loop finishes.
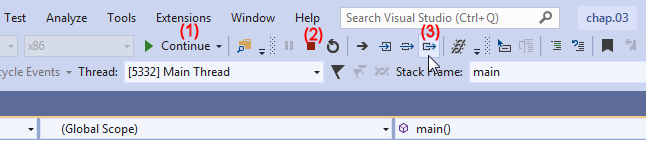
Ending the debug session. You can continue pressing the single-step button until the program finishes. However, if you would like to stop debugging, you can:
Press "Continue"
Press "Stop"
Press "Step Out"
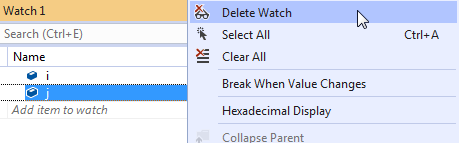
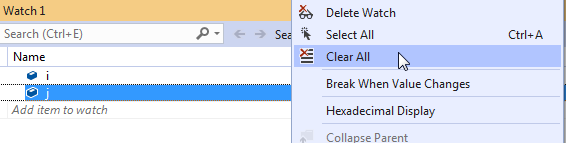
Clearing watches. You can add and remove watches whenever needed. If you no longer want to watch an item in the watch window, right-click it and select "Delete Watch," or select it and press the "Delete" key on the keyboard. You can also right-click anywhere in the watch window and select "Clear All" to remove all watches.