Although made with the Visual Studio 2019 debugger, the features and operations are typical of all modern debuggers. Once you learn what debuggers can do, you may need to consult the tool-specific documentation to learn how to perform the operations on your system.
The debugger becomes increasingly helpful as programs grow in size and complexity. Specifically, programs with many functions spread over many files are easier to debug with a good, modern debugger. As illustrated in previous chapters, breakpoints and the ability to run to the current cursor location are still vital operations. However, effectively debugging a function requires more dynamic monitoring of running programs. Three stepping operations, each one invoked with a different button, provide the needed monitoring capability.
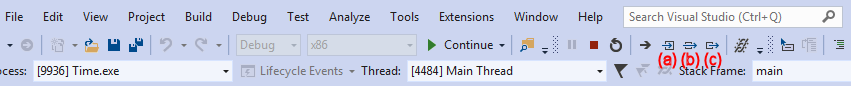
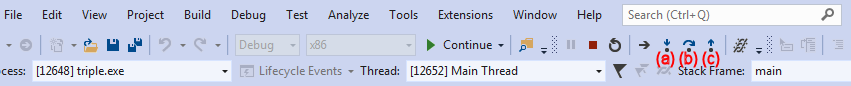
Stepping buttons. The three stepping buttons are context-sensitive, meaning they only appear while the program runs in debug mode. The buttons appear and are accessible when the program is paused at a breakpoint or after it has "Run To Cursor." The specific icon displayed on each button depends on the version of Visual Studio used.
Step Into (F11). Some debuggers call this operation single step because it runs a program one statement or instruction at a time. Position the cursor at a function call and press this button to step into the function. Each time you press the button, the debugger will run one statement until the function returns to the original calling location.
Step Over (F10). While debugging a program with multiple functions, programmers may want to focus on some but not all functions. For example, if some functions are already debugged and verified as correct. When a programmer positions the cursor at a function call and presses the step over button, the debugger runs all the statements in the function without pausing between them.
Step Out (Shift+F11). Once the debugger is in and stepping through a function, the step out button allows a programmer to run the function without further debugging. The debugger runs through the function without pausing between the statements.
The debugger is a dynamic tool, making it easier to demonstrate in a video than static text and screen images. So, the following figures only summarize some of the basic stepping operations.
Time: Step Into, Step Over, and Step Out
Review
The stepping tutorial uses the worked example from the previous section. Please review it as needed: