C++ forms arbitrarily complex statements by building them up from expressions, simple statements, and blocks. So, programmers create control statements by adding the controlling features to shorter statements. This approach implies that the debugging techniques presented in the last chapter remain useful for debugging control statements. However, control statements add two more concerns to the debugging process. First, they create dynamic, changing execution paths through a program, increasing the chance of logical and run-time errors. Second, the values (variables and more complex expressions) driving the dynamic execution paths are also dynamic and can change in unexpected ways. Manual instrumentation or a debugger can help programmers trace execution paths as they run and understand the values driving them.
Debugging if-statements.
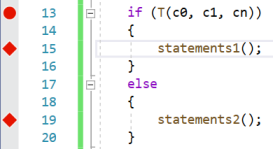
Programmers begin debugging if-statements by examining two things: the values controlling the statement and the branch that actually runs. It's easy to suppose that they can determine the latter from the former, but the nature of a logical error is that some code doesn't behave as programmers anticipate. Debugging a run-time error may also require tracing when the program leaves the running branch. The pseudo-coded examples assume an arbitrarily complex control test, T, based on a series of conditional expressions, ci, joined with unspecified logical operators.
Minimal instrumenting code highlighted in blue.
Programmers can use either a breakpoint or a tracepoint to examine the if-statement control, while tracepoints are an efficient way of identifying which branch executes.
Programmers can extend the illustrated patterns to debug an if-else ladder by adding trace operations to each additional branch in the ladder.
Manually instrumented statements are highlighted in blue.
Instrumentation output is sent to cerr because it automatically flushes the output buffer, often providing more information in the case of a run-time error. It also allows programmers to separate general program output from diagnostics with command-line file redirection.
Instrumenting the final else branch requires adding braces to it.
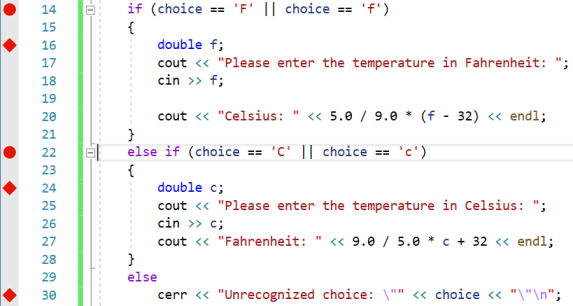
The breakpoint on 14 is sufficient for programmers to examine the values controlling the branch selection fully, but line 22 demonstrates that they can add more breakpoints if needed.
Tracepoints can label a branch or display expression values.
When using the debugger with the temperature program, braces around the final else statement are optional.
Debugging if-statements example.
The if-version of the temperature conversion program demonstrates how to debug if-statements in a C++ program using manually inserted instrumentation statements and a debugger.
Debugging switches is similar to if-statements. However, independent of the method, debugging switches has an additional benefit: if-statements can't inadvertently execute multiple branches, but switches can, deliberately or erroneously, execute multiple cases. A forgotten break at the end of a casecan cause a difficult-to-locate run-time error. A debugger or instrumented code can help identify and locate it.
cerr << choice << " " << __FILE__ << " - " << __LINE__ << endl;
switch (choice)
{
    case 'F':
    case 'f':
    {
        cerr << "case F " << __FILE__ << " - " << __LINE__ << endl;
        double f;
        cout << "Please enter the temperature in Fahrenheit: ";
        cin >> f;
        double c = 5.0 / 9.0 * (f - 32);
        cout << "Celsius: " << c << endl;
       break;
    }

    case 'C':
    case 'c':
    {
        cerr << "case C " << __FILE__ << " - " << __LINE__ << endl;
        double c;
        cout << "Please enter the temperature in Celsius: ";
        cin >> c;
        double f = 9.0 / 5.0 * c + 32;
        cout << "Fahrenheit: " << f << endl;
        break;
    }

    case 'E':
    case 'e':
        cerr << "case E " << __FILE__ << " - " << __LINE__ << endl;
        exit(0);

    default:
        cerr << "default " << __FILE__ << " - " << __LINE__ << endl;
        cerr << "Unrecognized choice " << choice << endl;
        break;
}
Manually instrumenting a switch statement.
The instrumenting code, highlighted in blue, traces the execution path through the switch statement. Programmers can add more debugging information as needed.
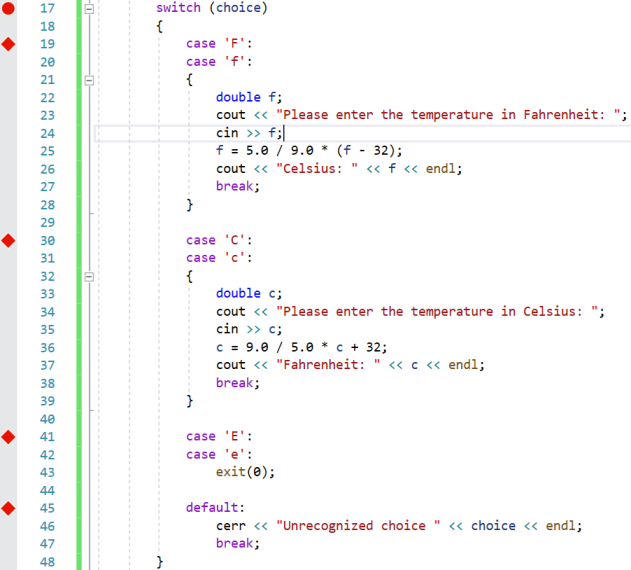
Using a debugger with a switch statement.
The screen capture illustrates where programmers typically set a breakpoint to examine the values controlling a switch statement, and set tracepoints to trace the execution path through it. Tracepoints are associated with executable code, so the line numbers in the output may be greater than those indicated by the diamonds.